Rapidly deliver apps people love to use
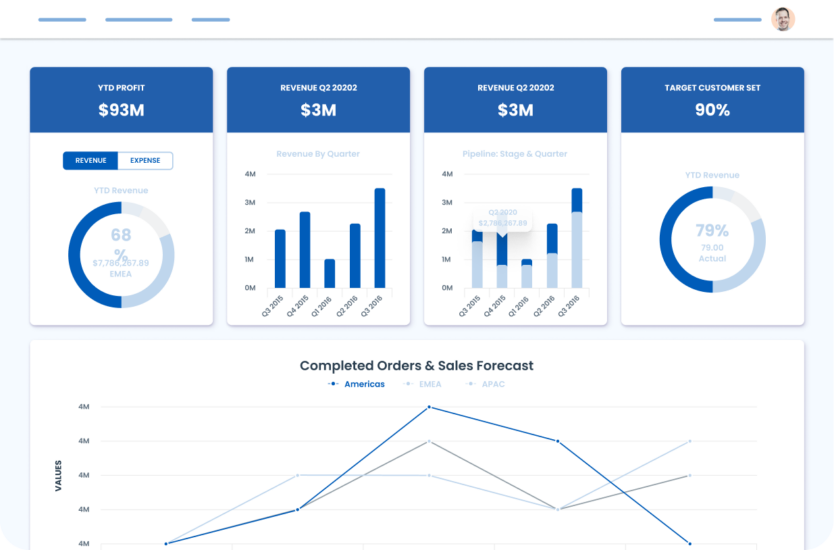
Rapidly prototype and build complete apps that connect systems and data, and boost team productivity, business agility, revenue growth, and customer retention. Deliver high-impact user experiences with clicks not code.
Intuitive
Create apps your customers and employees love to use without writing a single line of code by adding pages, connecting data, and then dragging-and-dropping components onto the page canvas.
Flexible
Data connectors support common approaches like SQL, REST, and OData. Mix and match your data from multiple sources into a single page to give your users a unified experience.
Customizable
Maintain your brand by making colors, fonts, button styles, and other visual elements of your app match company style guides, design systems, or branding specs without any HTML or CSS.
Connect multiple data sources
Bring data together inside a unified user experience with several out-of-the-box data sources. Once data sources are connected, you can mix and match your data within a single page.
Easily customizable components
Over twenty-five drag-and-drop components help you manage page layout, view data, add elements like images or charts, and more. Customize and configure the component and how data is displayed within it.
Create logic flows that take action on connected data
Build comprehensive expressions and actions that can be triggered from multiple places within an app. Change component and element styles with multiple types of display logic. Each type triggers a style change based on a data value or user interaction with the UI.
Create and maintain design systems with ease
Make colors, fonts, interaction states, button styles, and other visual elements of your app match company style guides, design systems, or branding specs — no CSS or HTML needed.
App development for Salesforce
Improve your Salesforce user experiences with custom user interfaces, reporting, dashboards, portals, libraries, and more. Drive activity visibility, increase forecast accuracy, accelerate time to revenue, and boost Salesforce adoption within your team.

Latest App Development resources
Try Skuid NLX for free
Start free trialSupport at every step
Look to Nintex Process Experts to support you at every step in your process transformation journey.
Get support


